Examples
In all examples the settings come from the preset file fx-CG50.toml.
If you copy this examples an run them without extra configuration you will be using the default.toml preset file which is different.
Draw a pixel
from casioplot import *

red = (255, 0, 0)
set_pixel(10, 10, red)
show_screen()  # Don't forget to show the screen to see the result.
Result:
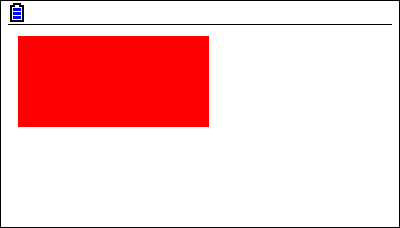
Draw a rectangle
from casioplot import *


def rectangle(start_x, start_y, end_x, end_y, color):
    width = abs(end_x - start_x)
    height = abs(end_y - start_y)
    for x in range(width + 1):
        for y in range(height + 1):
            set_pixel(start_x + x, start_y + y, color)


red = (255, 0, 0)
rectangle(10, 10, 200, 100, red)
show_screen()  # Don't forget to show the screen to see the result.
Result:
Get a pixel value
from casioplot import *


def rectangle(start_x, start_y, end_x, end_y, color):
    x = abs(end_x - start_x)
    y = abs(end_y - start_y)
    for i in range(x + 1):
        for j in range(y + 1):
            set_pixel(i + start_x, j + start_y, color)


red = (255, 0, 0)
rectangle(10, 10, 200, 100, red)

pixel_color = get_pixel(20, 20)
match pixel_color:
    case r, g, b:
        print('Red:  ', r)
        print('Green:', g)
        print('Blue: ', b)
    case None:
        print('Out of the screen.')
Result:
Red:   255
Green: 0
Blue:  0
Note that you don’t need to show the screen to get the color of a pixel.
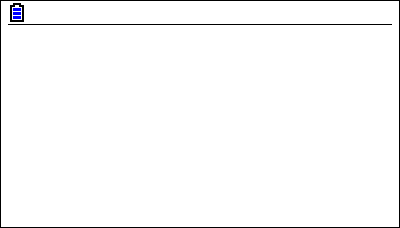
Clearing the screen
from casioplot import *

 def rectangle(start_x, start_y, end_x, end_y, color):
     x = abs(end_x - start_x)
     y = abs(end_y - start_y)
     for i in range(x + 1):
         for j in range(y + 1):
             set_pixel(i + start_x, j + start_y, color)

 red = (255, 0, 0)
 rectangle(10, 10, 200, 100, red)

 show_screen()
 clear_screen()
 show_screen()
Result:
First call of show_screen:
Second call of show_screen:
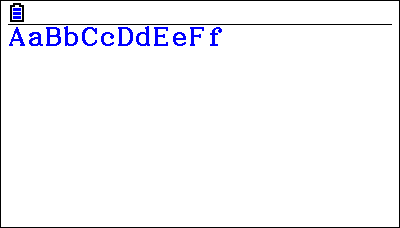
Writing
from casioplot import *

blue = (0, 0, 255)
draw_string(0, 0, 'AaBbCcDdEeFf', blue,  "large")

show_screen()
Result:
Demo
You can find more examples in the demo directory in the source code.